Australia Road Safety Award 2021
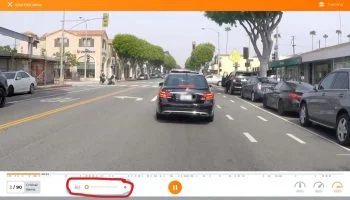
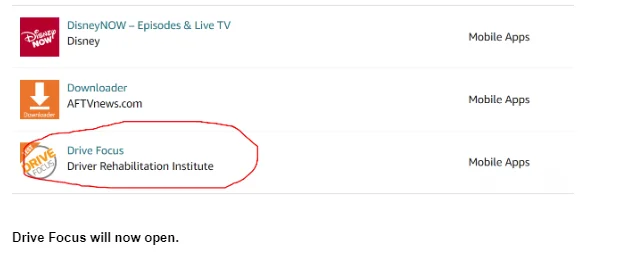
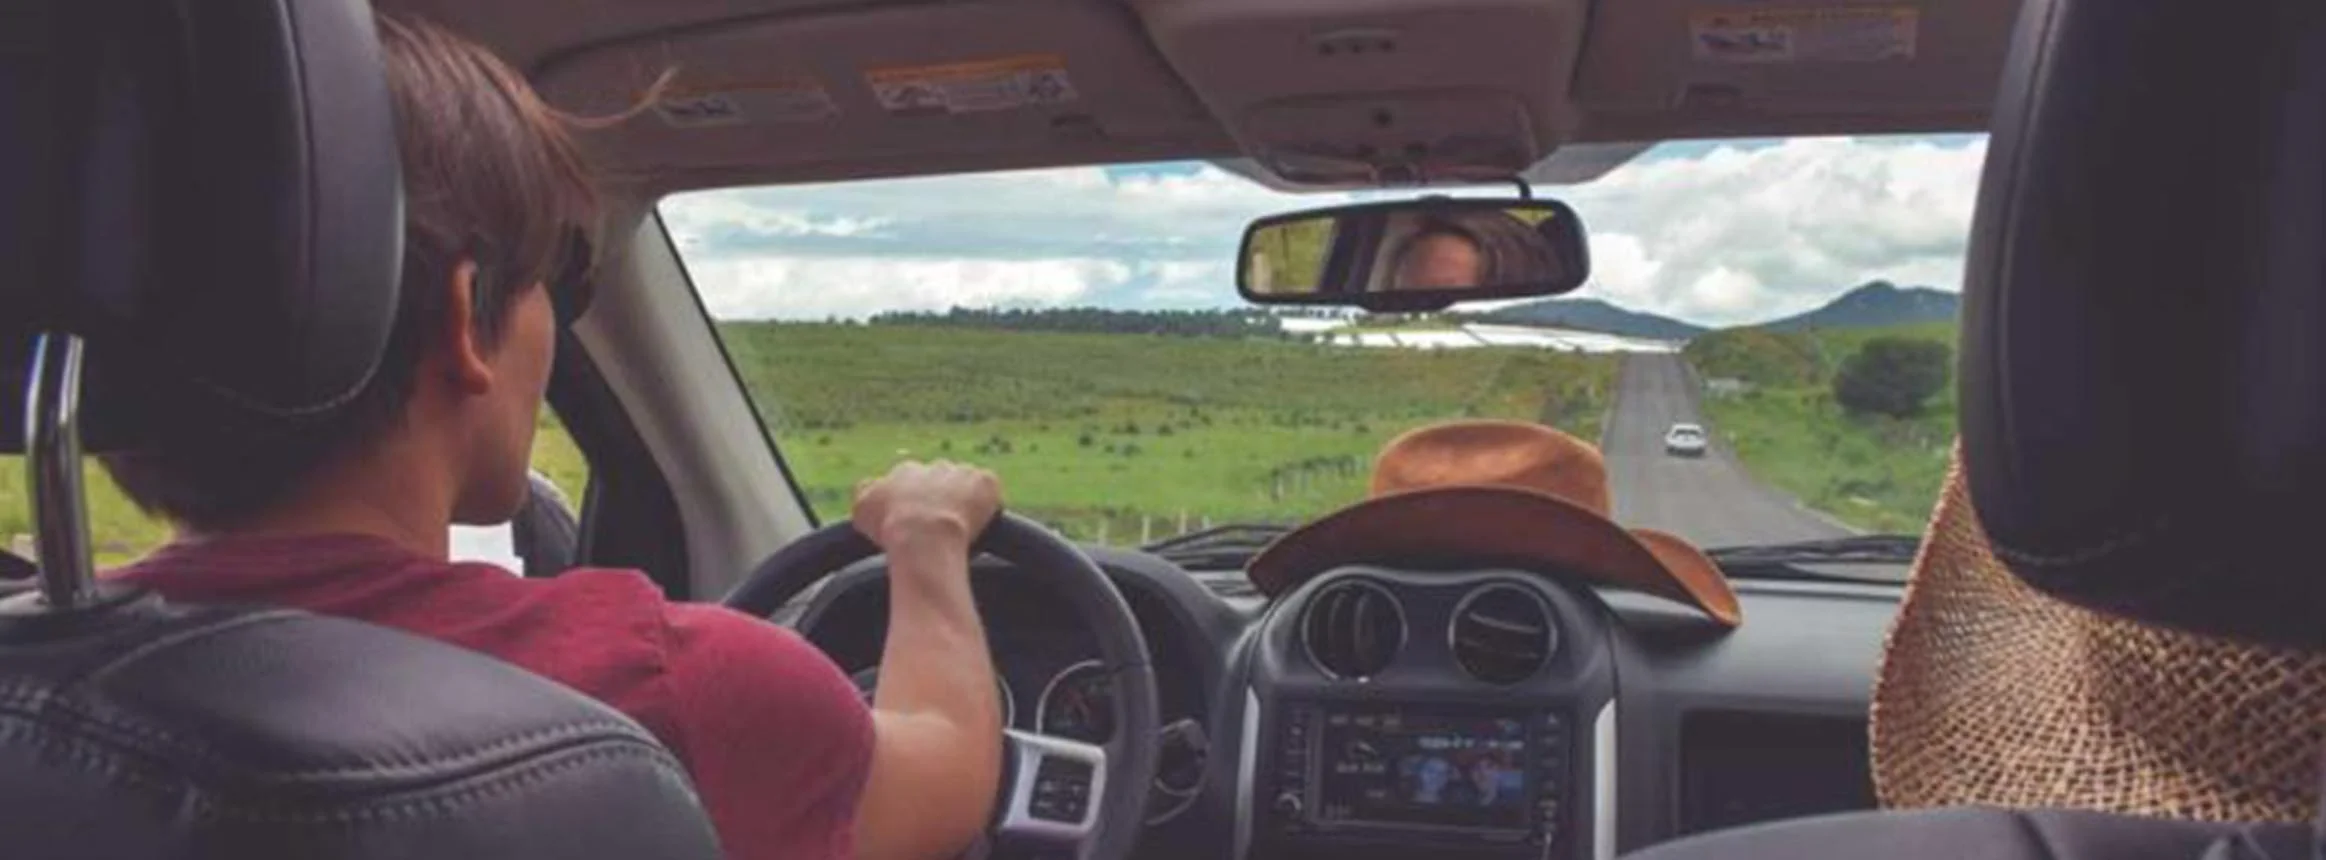
When Jenny Gribbin, owner of Driving Well Occupational Therapy in Queensland found her client benefited from Drive Focus, she also realized that most of the interactive drives were from the U.S. and Canada, where they drive on the “wrong” side of the road. Jenny filmed drives in Brisbane and arranged for a colleague in Melbourne...